

North Bay CRE Market Pulse | Q1 2026
Commercial + Multifamily Quarterly Edition
- Rates stayed elevated. The 10-Year Treasury ended Q1 near 4.84%, with the quarterly average around 4.75%.
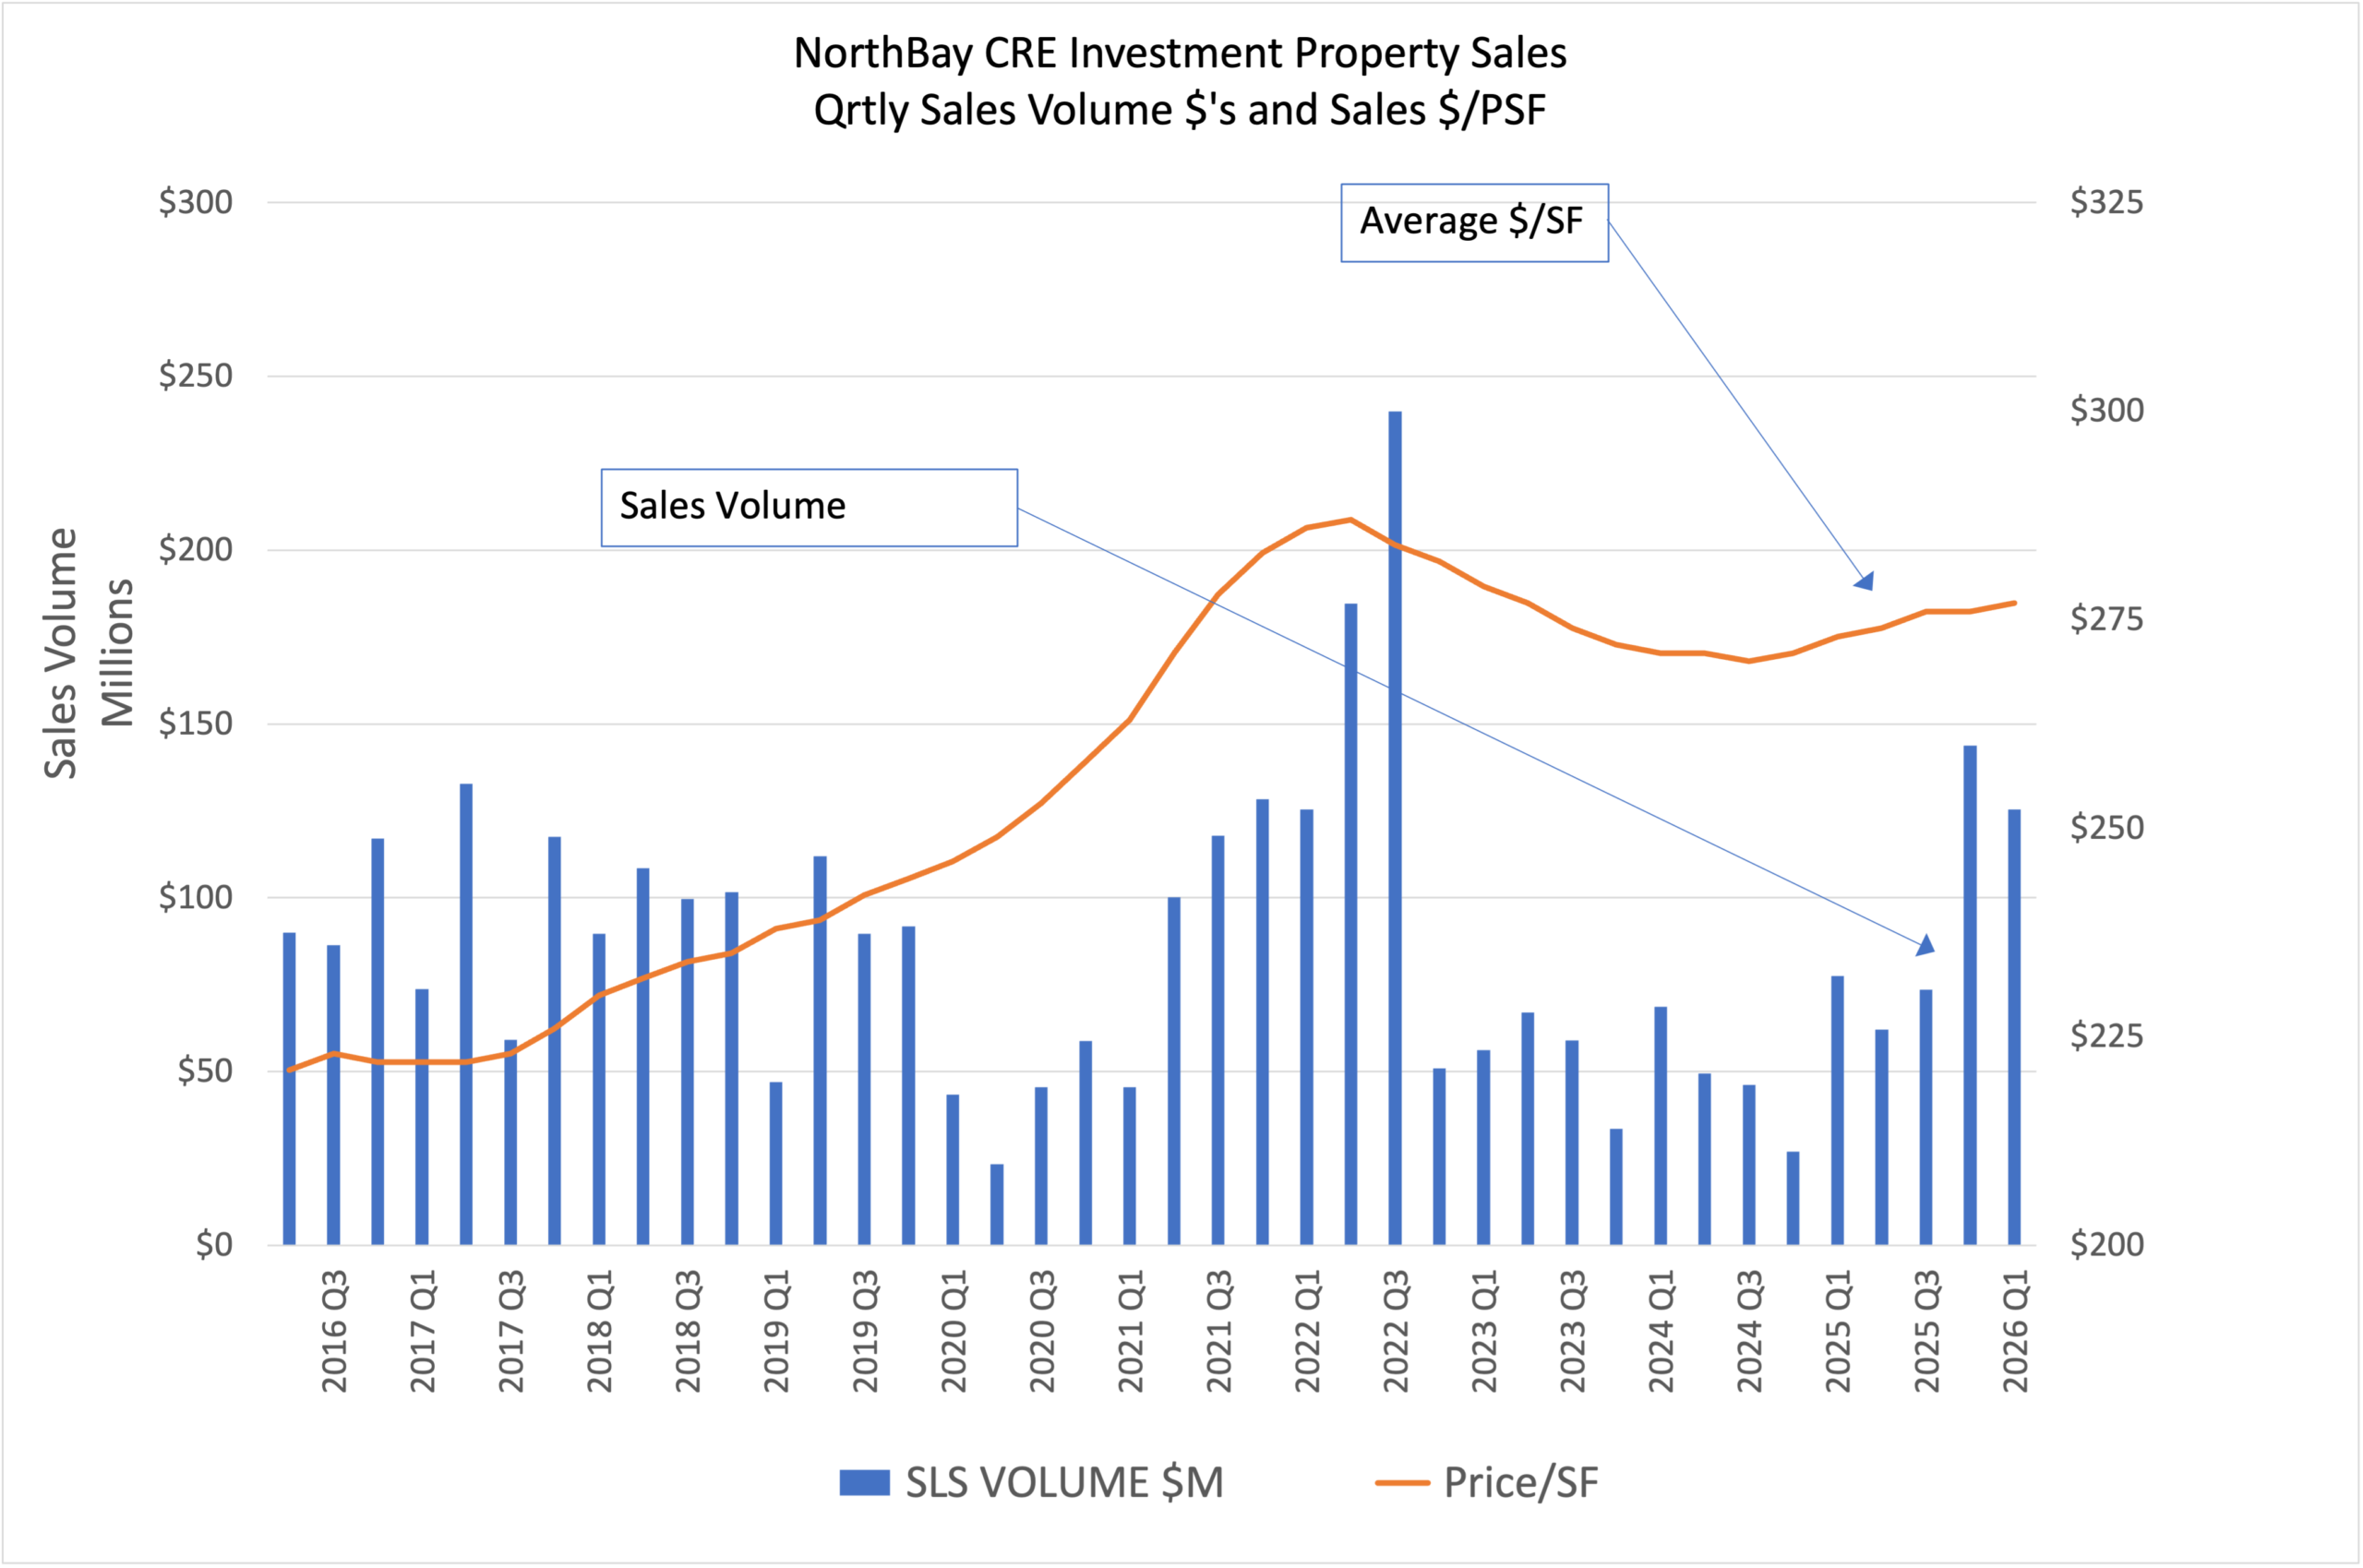
- Values were relatively steady. North Bay CRE pricing averaged about $277/SF. Multifamily averaged roughly $306,855 per unit, slightly below last year.
- Cap rates still favor buyers. CRE cap rates are around 7.3%. Multifamily continues to trade in the high-5% range.
- Leasing softened. CRE vacancy rose to 8.4%. Multifamily vacancy increased to 5.7%.
- Deals are getting done, selectively. Buyers remain active, but disciplined.
Commercial Real Estate (Office • Industrial • Retail)
What moved in Q1
- Vacancy: 8.4%, up year-over-year.
- Rents: Down about 4.6% year-over-year overall. Industrial held up best.
- Absorption: Still negative, with roughly -688,783 SF over the last 12 months.
- Pricing: Average sales pricing was about $277/SF, modestly above last year.
- Listings: About 175 properties were on the market.
What it means
This is still a quality-first market. Buyers are showing up for well-located, functional properties with a clear income story and realistic pricing. Industrial remains the steadiest sector. Office continues to sort itself out. Retail is mixed but still active.
For Owners/Sellers
- Clean up diligence before going to market
- Tell the income story clearly
- Price for today’s debt environment, not yesterday’s
For Buyers/Investors
- Entry yields are better than they were a year or two ago
- Function, location, and durable income matter
- Well-priced deals still move
Multifamily (5+ Units)
What moved in Q3
- Pricing: ~+2.5% q/q (per unit); cap rates ~+100 bps y/y → healthier cash-on-cash.
- Supply: ~93 active listings—strong choice without systemic distress.
- Sales: +33% q/q as sellers recalibrate and buyers underwrite to today’s rates.
- Rents/Operations: Rents ~+1% y/y overall. Prime assets retain tenants and capture targeted renewal bumps; dated assets face softer trends and selective concessions.
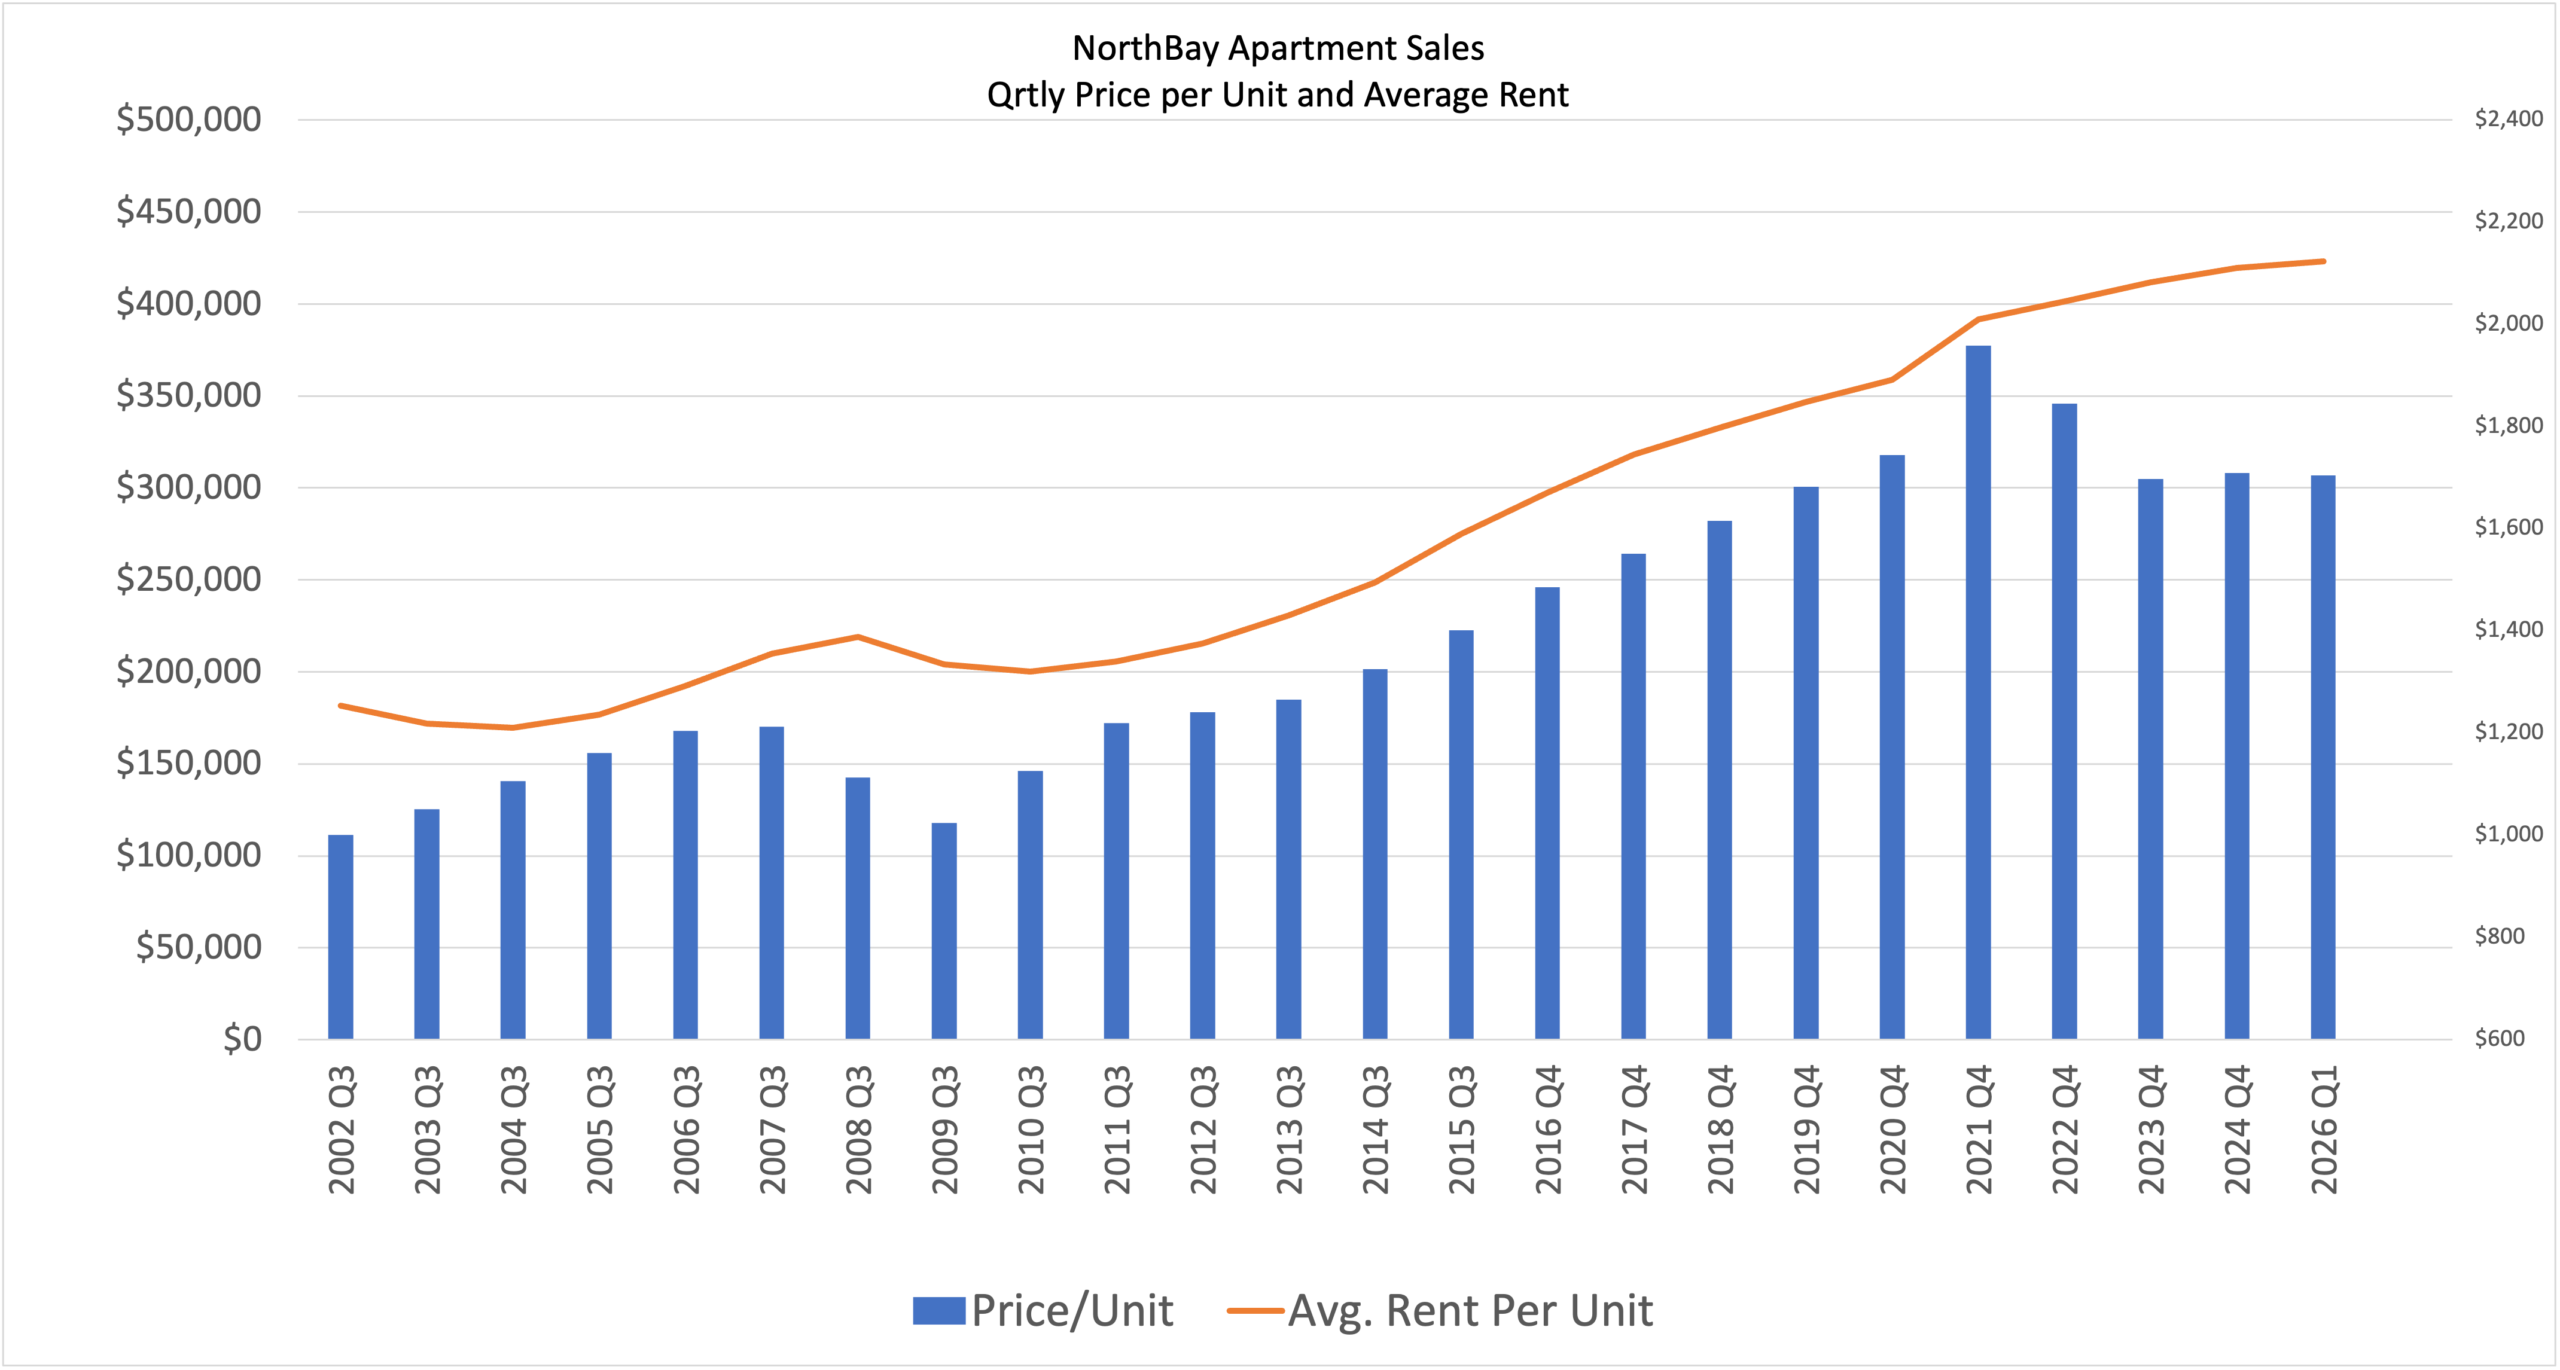
*** This survey Includes: 4,060 CRE medium size (5-50k sf) multitenant buildings and 2,783 apartment buildings located in the North Bay.
What Moved in Q1
- Inventory: About 2,783 buildings with roughly 102,093 units.
- Vacancy: 5.7%, up from both last year and last quarter.
- Rents: Roughly flat to slightly down, about -0.2% year-over-year.
- Pricing: About $306,855 per unit, slightly below last year.
- Recent trades: Roughly $301,149/unit, $339/SF, 11.82 GRM, and a 5.88% cap rate over the last six months.
- Listings: About 69 multifamily properties were on the market.
What It Means
Buyers are underwriting harder. They are paying close attention to true expenses, deferred maintenance, insurance, and realistic rent growth. Still, well-located buildings with a clean operating story continue to attract interest.
For Owners/Sellers
- Tighten up lease files, rent roll, and financials
- Show upside that is credible
- Expect more scrutiny on expenses
For Buyers/Investors
- There is room for disciplined buying
- Simpler value-add plays tend to perform best
- Conservative underwriting still wins
How I Can Help?
- Valuation & strategy: hold, refinance, improve, or sell
- Acquisition modeling: realistic cash flow and yield analysis
- Go-to-market prep: pricing, positioning, and buyer outreach
Curious how these shifts hit your specific property or a target deal? IM me or reply to this email—let’s run the numbers together.
Testimonial:
” Ces guided us expertly through the preparation and sale of our San Anselmo mixed use commercial building, adding value every step along the way. With his adept guidance, our sale went smoothly. We highly recommend Ces for his knowledge and if you are looking for a straightforward, successful real estate transaction.
— David and Paige Hirshkop